To demonstrate the capabilities of Excel Services, consider the following scenario:
AdventureWorks, one of
your clients, has implemented SharePoint 2010 as its corporate intranet
platform. To increase awareness of company performance within the
organization, you’ve been asked to add an indicator of global sales to
the front page of the intranet site. Since AdventureWorks is a global
organization, it should be possible to filter the sales figures by
geographic region, and the amounts shown should be visible in a range of
currencies, selectable by the user.
It probably comes as no surprise
to learn that we can implement this solution using Excel Services. We
can render an interactive chart using the Excel Web Access web part, and
if we base the chart on a pivot table, data will be automatically
refreshed. To filter the sales figures by geographic region, we can
incorporate a slicer into the design, which will allow users to select
from a graphical list of available regions.
Displaying the
results in various currencies is a bit more involved, since the data in
the underlying database is stored in a single currency only. To achieve
this, we’ll create a custom UDF that will retrieve current exchange
rates via a web service call. We’ll then make use of that data to
recalculate the workbook in the appropriate currency. Because we want to
allow the user to select from a list of currencies, we’ll make use of
the JavaScript API to pass in a currency code selected from a drop-down
list. When the currency code is passed into the workbook via the API,
the workbook will be refreshed using the appropriate currency.
Set Up Adventure Works Sample Database
To provide some sample data to
work with in our various examples, we need to download and install the
SQL Server 2008 sample databases from www.codeplex.com/MSFTDBProdSamples. Our examples make use of the AdventureWorks OLTP database installed on the local instance of SQL Server 2008.
Create a Sample Site
Now we’ll create a new blank
site to use for development. Note that if we were creating a complete
Business Intelligence (BI) solution or intended to use the site mainly
for hosting dashboards, the Business Intelligence Center site template
would be a more appropriate place to start. Since we’re using only a
single Excel workbook, we’ll make use of a basic blank site.
In SharePoint Designer, choose File | Sites, and then click the New Blank Web Site button. Type the name of the new site as http://localhost/Example.
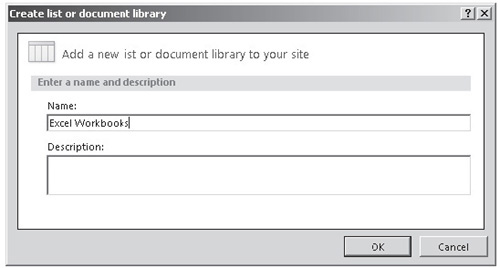
We’ll add a new document library to host our Excel Workbook. From the Site Objects pane, select Lists and Libraries.
From the ribbon, select Document Library | Document Library. Name the new library Excel Workbooks:
Create a Workbook for Use with Excel Services
Before we can make use of an
Excel workbook in SharePoint 2010, we need to create it using the Excel
client application. For our demonstration scenario, we need a simple
workbook that contains a pivot table and a pivot chart. The pivot table
should be generated from data stored in the organization’s ERP system.
Open
Excel 2010. A new blank workbook will be automatically created, and we
can make use of this workbook for our demonstration. First, we need to
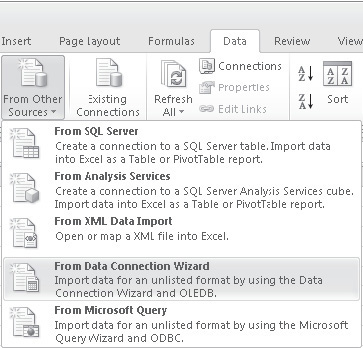
add a data connection so that we can retrieve appropriate sales data. On
the Data tab, in the Get External Data section of the ribbon, select
From Other Sources | From Data Connection Wizard, as illustrated:
In the Data Connection Wizard dialog, accept the default selection of Microsoft SQL Server by clicking Next to proceed.
In the Server Name text box, enter .\SQLExpress. For the Log On Credentials, select Use Windows Authentication. Click Next.
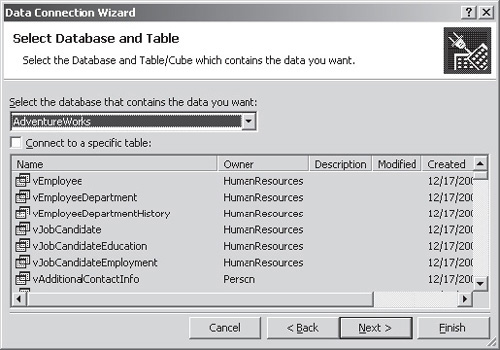
In
the Select Database and Table step, change the selected database to
AdventureWorks, and uncheck the Connect To A Specific Table checkbox as
shown. Click Finish to complete the wizard.
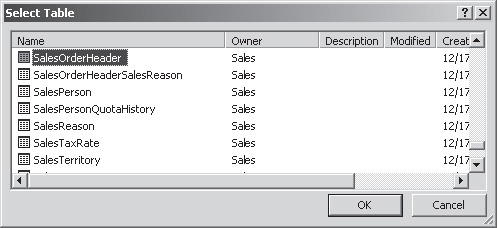
After
the wizard has completed, the Select Table dialog is displayed.
Although the data that we require comes from more than one table, we
need to select a table to create a connection in our workbook. Select
the SalesOrderHeader table, as shown, and then click OK.
The
Import Data dialog allows us to select what we want to do with the
connected data and includes a few options, such as Table and PivotTable
as well as a range selector that we can use to specify where the data
should appear in the workbook. When using Excel Services, you should be
aware that only PivotTables can be refreshed on the server. Although it
is possible to add a table and use the data within the table in Excel
Services, the only way to refresh the table data will be to open the
spreadsheet in Excel and refresh manually. Bearing this in mind, select
PivotTable Report and put the data at the default location of $A$1 in
the current worksheet.
Configure a Data Connection
A
new PivotTable is inserted on the page at the specified location.
Before we start configuring the PivotTable, we need to review our
connection settings. Recall that we selected the SalesOrderHeader table
as the source of our data; before we can set up our pivot table, we need
to change this to use a SQL query instead.
From
the Data tab, select the Connections option. In the Workbook
Connections dialog, select the ._sqlexpress AdventureWorks connection.
Notice that your connection may have a slightly different name,
depending on your database server and whether an existing connection
with that name already exists.
Click Properties to view the connection details. Change the connection name to AdventureWorksLast30DaysSales.
Click
the Definition tab to see details of the connection string, the command
type, and the command text as well as a few other options. Change the
Command type to SQL and enter the following SQL statement in the Command
Text text box:
SELECT      H.OrderDate,
            T.Name as Territory,
            T.CountryRegionCode as CountryCode,
            sum(TotalDue) as TotalSales
FROM        [Sales].[SalesOrderHeader] as H
INNER JOIN  [Sales].[SalesTerritory] as T
ON          H.TerritoryID=T.TerritoryID
WHERE       H.OrderDate>'2004-07-01'
GROUP BY    H.OrderDate, T.Name, T.CountryRegionCode
When
a data connection is used by Excel, a copy of the connection
information is stored in the workbook. In the Properties dialog, we’re
effectively editing the properties of this cached copy of the data
connection. To update our locally saved connection file, click Export
Connection File and then, in the file dialog that appears, type the
filename as AdventureWorksLast30DaysSales.odc. Click Save to create the new Office Database Connection file.
Click
OK to close the Properties dialog, and then click Close to close the
Workbook Connections dialog. Notice that the fields listed in the
PivotTable Field List have changed to match those in our amended query.